Your ticket sales hit the ground running. You’re getting great sales on your website, on Eventbrite, even over the phone. But then you hit a wall. Sales slump. The line goes dead.
Some may panic and start throwing money around, hoping it will stick. But you don’t have to waste your budget on attracting buyers. Using Eventbrite Reports, you can sift and sort through valuable data in seconds to target exactly what efforts are serving you, and which you might need to abandon.
The Report options can be daunting, especially if you have no inkling of where to focus your analysis. To help you get better acquainted with the Organiser dashboard and Event Reports, we have compiled our top Reports and how best to approach them.
Access your Eventbrite Reports with ease
To access your reports, log in to your Eventbrite account. For the majority of these reports, remember that you can customise the date range and export the data to an Excel sheet to more easily sort and view information.
Attendee Summary
To access click “Analyse,” then “Event Reports” on the left-hand menu.
What it is: Attendee Summary generates a data line for each individual ticket buyer with information like how many tickets they purchased, their order number, and their email. You also have the ability to sort by custom question responses (and more) in the dropdown menu.
Why organisers use it:
- Identifying merchandise orders that need to be fulfilled by mail
- Sorting out emails from new customers who need to be added to an email list
- Identifying trends in attendees to targeting them in Facebook lookalike audiences for future events
Analytics
To access, under “Analyse,” click “Analytics.”
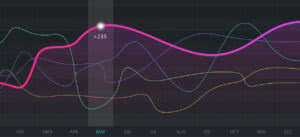
What it is: Analytics compiles information about your ticket sales. Analytics data can be presented in four different ways to make it easy for you to analyse the evolution of your ticket sales or registrations.
Why organisers use it:
- Traffic: See how many views your event listing has received over time.
- Sales: View the total sales for your event over time.
- Sales Channel: View total sales for your event by the various channels like your website, Facebook Events, and your Eventbrite Event page. This can help you identify which channels are benefiting you the most.
- Attendees: View a heat map of your ticket buyers. This is useful for creators looking to expand. If your event has major sales in a neighbouring city, for example, you may want to consider moving your event or adding a second one entirely.
Sales Summary
To access click “Analyse,” then “Event Reports” on the left-hand menu.
What it is: Sales Summary allows you to view your sales by ticket type, providing valuable information about the efficacy of your tiered pricing.
Why organisers use it:
- Sorting attendees by ticket type and preparing to fulfill the promised benefits of each type (i.e. preferred seating)
- Analysing the effectiveness of each ticket type in encouraging sales and engagement
Get started with reports
To view your own reports and customise them to meet the needs of your event, sign in to your account now.