Is your event website performing as well as it could be? There’s only one way to find out and that’s by analysing your site data.
It sounds technical, but fortunately there are a range of tools to make the job easier and provide you with actionable insights.
Finding out where any ‘sticking points’ might be on your site can enable you to increase the amount of visitors who complete the ticket buying process.
Meanwhile, being able to test out different wording, calls to action and design layouts will let you hone your site to perfection. Try these 6 conversion rate optimisation (CRO) tools for yourself.
Free download: How to double your ticket sales with Conversion Rate Optimisation
You probably already have Google Analytics installed on your website, but are you making the most of it? Besides seeing how many visitors you get and the depth they go into on your site, there are several more advanced features you need to exploit.
One such feature is ‘Events,’ which lets you track any element that your visitors interact with, such as downloads they make, widgets they use, external links they click and social media buttons they press. It can even tell you how long they spend watching videos.
You’ll need to set up the ‘events’ in your Google Analytics dashboard and add a bit of JavaScript to the element that you want to track, but The Google Analytics Event Tracking Guide shows you exactly how to do this.
Another excellent advanced feature is ‘Content Experiments,’ which enables you to test up to 10 variants of a landing page to see which is most effective in driving the behaviour you desire.
Content Experiments is different to standard A/B and multivariate testing, as you are testing up to 10 full versions of a single page, each delivered to users from a separate URL.

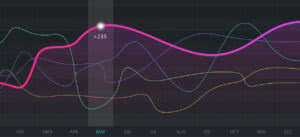
A Google Analytics ‘Content Experiments’ report
HotJar aggregates a handful of useful CRO tools into one easy-to use dashboard, offering a ‘bird’s eye view’ of how visitors interact with your website.
Use the heatmaps feature to see visitors’ clicks, taps and scrolling behaviour visually represented. You can segment visitors into device-types to see if visiting on a mobile device makes a difference to behaviour.
HotJar also lets you record videos of real user’s actions – watch recordings as they click, tap, move their cursor, type and navigate across pages to identify any usability issues.
You can also see on which page and at which step visitors leave your site, and improve online form completion rates by discovering when and why your visitors abandon your forms.
And if you want to know what users really think, you can ask them via exit surveys, feedback polls or by recruiting user testers.
One of the best things about this tool is the price; just $29 a month for an unlimited number of tests (for sites with up to 10,000 pageviews per day). There’s a basic free plan too for low traffic sites.

A heatmap on HotJar
SumoMe is a collection of standalone tools to boost your site’s performance, including on-site analytics apps.
These include ‘Google Analytics by SumoMe’, which enables you to view your Google Analytics directly in the SumoMe dashboard, plus ‘Heat Maps’ which shows you, in real-time, exactly where people are clicking (or not) on your site.
But perhaps the most interesting feature is ‘Content Analytics’ which is designed to show you how much of your page actually get read! This is really useful if you maintain a blog or news section and want to know how interesting and relevant your content is to visitors.
Content Analytics gives you a visual display of exactly where people stop reading your blog posts. This not only helps you learn how to improve your content, but also ensures that you deliver your message at the right time.
Long form posts can have additional SEO benefits so you might not want to cut them too radically, but you can move your calls to action higher up and put your important information at the top!

SumoMe’s ‘Content Analytics’ feature
CrazyEgg offers four CRO tools including heat maps, confetti maps, scroll maps and overlay reports.
Confetti maps are so called because they show all of the individual clicks on your site, depicted in different colours to highlight information such as referral sources and search terms. This enables you to identify where your most valuable click traffic is coming from and target it further.
Scroll maps show how far down the page people are scrolling before leaving, indicating exactly where to add elements to hold visitors’ interest longer.
Meanwhile, overlay reports clearly show the number of clicks on each element of your page so you can work on getting more of the clicks that result in ticket purchases.

A ‘confetti map’ from CrazyEgg
Optimizely is an A/B testing platform enabling you to experiment with everything and see how it affects visitor engagement and, ultimately, your event ticket sales.
It can also help you deliver personalised content for different visitors. Tailor what they see based on data such as whether they’ve visited the site before, what type of device they’re using, where they live or even the weather.
You can use what you know about customers together with third party information to build a uniquely tailored experience for your visitors.

An example of Optimizely’s targeted content
Ominconvert also offers A/B testing along with a handy visual editor where you can make changes to elements of your site without the help of a web designer. You simply choose from a selection of options and within five minutes the changes will be displayed to the selected audience. You’ll then be able to track how the changes affect your results.
The platform also boasts extensive segmentation and customisation options. You can, for example, target only the people that come from social media websites or visitors who come from your AdWords campaigns.
You can also define buyer personas such as “True friends” (loyal customers) or “Sherlock Holmes” (just investigating) by mixing behavioural data like the number of days since first or last visit, search behaviour and total revenue spent.

Source segmentation on Omniconvert
Conclusion
If you’re marketing your event online and not using these tools, then there’s is every chance you’re losing out on business.
Optimising your site for conversions means you can make the most with what you currently have, before splashing out on expensive advertising that potentially won’t bring the ticket sales you’re looking for.