![Explori Event Data Collection Tool [Review]](https://meetings.skift.com/wp-content/uploads/2019/10/410x272-FEAT-hompage-explori.jpg)
Explori Event Data Collection Tool [Review]
Explori: What Is It?
Explori is a comprehensive survey platform and reporting tool created specifically for the global events industry. It aims to help event organisers prove the impact of their events with high-level feedback data.
Current survey tools don’t always see a high rate of completion and don’t integrate with tools that allow event professionals to make sense of the results in a meaningful way.
By providing survey data trends over time rather than just the data for individuals at particular events, Explori puts the data from a given event in context to provide indications of how well the event is doing relative to past years and other verticals. This lets planners and exhibitors measure the improvement of attendee experiences, predict future attendee behavior, and demonstrate the big-picture impact of their events.
WHO IS IT FOR?
Explori is for any event professional or exhibitor gathering attendee feedback and analyzing it year over year for actionable insights into their event trends. The software can be used to facilitate event feedback, and the resultant data can inform changes and measure the effects of decisions over time.
Corporate event organizers and exhibit marketers can implement the tool to identify best practices and view the impact of their trade show strategies. B2B event agencies may also use Explori’s benchmarking capabilities to demonstrate consistency in event quality to clients and other stakeholders.
A full onboarding is provided and there is a knowledge-base, but live support outside of normal UK working hours is currently only available at an additional cost. In addition, planners should be aware that Explori does not yet offer support in languages other than English, French, and German.
MAIN FEATURE CATEGORIES
Attendee Feedback. Explori provides event planners and exhibitors with attendee feedback tools such as pre-programmed questions and survey templates that are customizable depending on the planner’s needs. The platform also includes the ability to manage email reminders and brand surveys to increase the response rate.
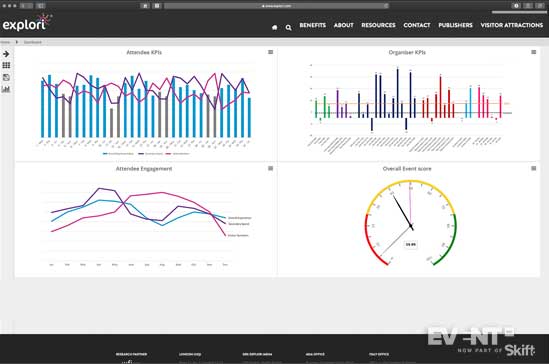
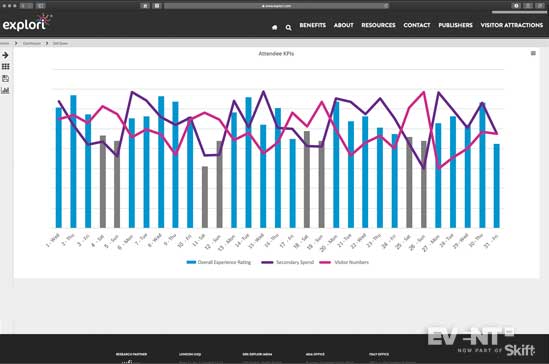
Data Analysis. The platform includes reporting tools that produce data based on the feedback received. The event dashboard includes all of the results and metrics for a particular event. One such metric, the Overall Event Score (OES), aggregates a number of common metrics into a single score that can be analyzed and compared to previous years and other events (more on this below).
Benchmarking. Explori allows planners to create internal benchmarks in order to compare events within a portfolio year over year.
Review
Explori facilitates the collection of post-event data and attendee responses, and transforms them into digestible metrics and data to inform strategic decisions and provide an overall picture of the event impact.
Designing and releasing surveys for attendee feedback can be done directly on the platform, which features survey template and suggested questions available in 18 languages. The platform also allows for the management of email reminders to bolster the attendee response rate.
Surveys can be created from templates and question libraries, which planners can configure to their requirements. While these are customizable, the templates and libraries are intended to support the standardization that is needed for successful benchmarking. Planners can also add their own branding to ensure the survey’s design fits with the overall brand image.
As feedback is collected, Explori compiles the numerical data and free-text responses into simplified high-level metrics like Loyalty and the Overall Event Score.
The various data analysis tools allow users to view year-to-year and cross-event comparisons, which allows organizations to establish internal benchmarks. These can be used to determine whether any changes were significant or in-line with the previous year. The event dashboard also displays attendee behavior metrics.
Explori’s in-house teams represent another valuable resource for planners as their support team is able to provide best practices on sending out surveys, while their research services can provide further data analysis and strategic suggestions if requested.
Features
Mandatory Question Lists: planners can choose to include certain important questions in every survey their team sends out using a customizable ‘Q List’ of mandatory questions.
Easy Distribution: using Explori, surveys can be shared with stakeholders as either Word or PDF documents for final approval before sending them out to attendees.
Data Integration: Explori allows for the integration of other types of data, such as registration, CRM, and onsite behavioral data, to enhance the quality of the overall data stored in the Explori platform and to avoid having to include repetitive survey questions.
Survey Templates: various survey templates are included with the tool, which can be customized depending on the planner’s needs using the Builder tab in the survey section. Customized surveys can also be saved for future use.
Tiered Data Access: event planners have the option of limiting access to certain events or portfolios based on which team members are working on them.
Branding Options: Explori surveys offer design flexibility, which provides planners with the opportunity to brand their surveys and ensure they convey their brand values, to increase the recipient’s trust and likelihood of responding.
Question Library: included with the survey materials are a variety of professionally-written, ready-to-use questions that have been translated into 18 languages. The questions are organized by various event types, such as Internal Events Questions and Corporate Events Questions, and can be applied to each survey with a drag-and-drop feature. Questions are automatically populated with the relevant event name, when applicable, to save planners the effort of having to manually edit each question containing the name of the event.
Questions are further categorized are as follows:
| Profiling | Sessions |
| Purchasing | Sponsors |
| Awards | Behavior |
| Drivers | Evaluation |
| Networking | Delegate Ticketing |
| Venue |
Customized Survey Experiences: Explori surveys are equipped with skip logic and routing, allowing planners to create a personalized experience for each respondent based on their unique interests and responses.
Survey Send Tools: planners can manage the entire survey sending process from the Explori platform using built-in send and reminder tools that allow for managing opt-outs and sending automated reminders.
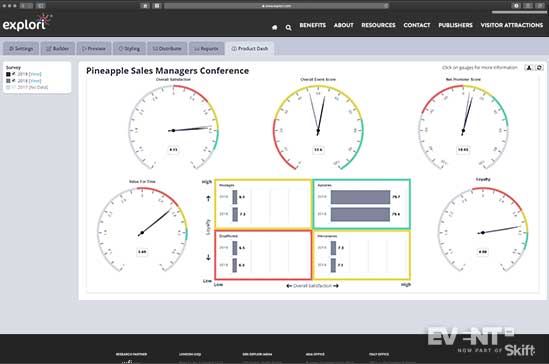
Event Performance Dashboard: under each event, there is a tab called Product Dash that allows the user to view the event’s dashboard. The dashboard compiles the survey responses into actionable data and includes the following metrics:
- Overall Satisfaction
- Value for Time
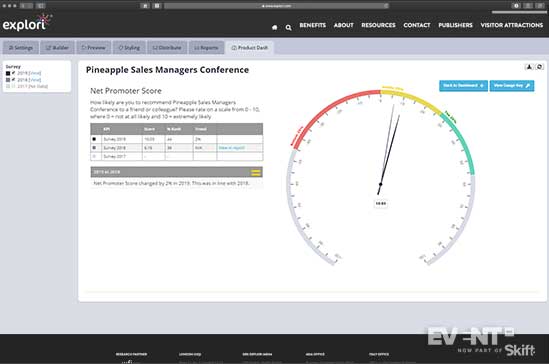
- Net Promoter Score
- Loyalty
- Overall Event Score
Clicking on a metric will zoom in on that particular dial and allow you to further investigate the data, including a comparison of the previous year’s results.
Overall Event Score: a metric unique to Explori, the Overall Event Score is generated using a complex algorithm that combines a number of metrics into a single score that provides a more accurate, overall event rating and allows for comparison to other events.
Portfolio Creation: Under the Portfolio tab in the Main Menu, users can add new event portfolios and indicate both the relevant industry as well as which events belong to which portfolio. Events can be added under the Product tab. This feature enables Explori to recognize which of your events are related to each other and allows for cross-portfolio analysis.
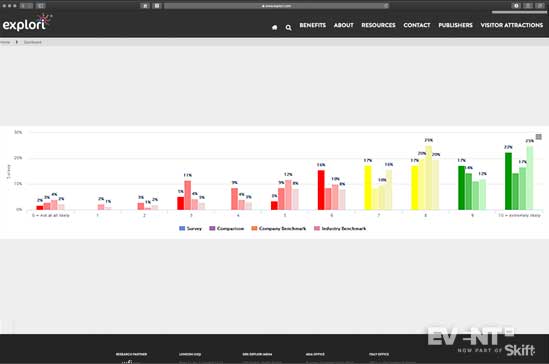
Comparative Analysis: within each event folder, next to the Product Dash tab, there is a tab labeled Reports, which allows planners to visualize the results for each survey question as well as relevant questions that may have been included in the registration form. Most importantly, these reports allow for comparison with data from previous years, internal benchmarks, and industry benchmarks to better evaluate the success of each event in a greater context.
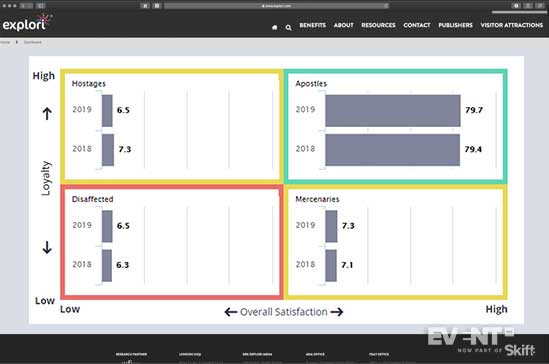
Customer Behavior Models: the analytics tool within the platform automatically produces customer behavior models such as the Loyalty vs. Satisfaction Matrix, which predicts future customer behavior, as well as the predicted spend needed to reach your objectives.
Industry Benchmarking: Current trade show clients can understand their performance in the context of the wider industry, by event type, geography, and sector. This feature has yet to be rolled out for corporate planners as the client base grows.
Annual Management Summaries: Depending on the planner’s needs, Explori can provide further performance analyses led by an event research specialist on an annual basis, which combines the event feedback data with industry insights.
Pricing and Plans
Pricing is license-based, with the minimum requirement per event being a self-service event license that includes unlimited surveys for a full cycle. Supplementary services such as data importing are available as add-ons, including an option to use Explori as your own in-house event research team. Explori uses a tiered pricing model, so the pricing of licenses and add-ons depends on the size of the event as well as the volume of licenses purchased.
Pros
- Extensive feedback analysis tools
- Allows for integration of registration or CRM data
- Can be combined with other data sources or research techniques such as in-person and pop-surveys
- Customer support team provides training and support
- In-house research team can interpret findings and provide clients with strategic suggestions
- Explori clients have priority access to the latest industry reports and trends
Cons
- Standard support is limited to UK working hours (support outside these hours can be arranged at an additional cost)
- Bigger investment compared to freemium tools
- Support languages currently limited to English, French, and German
IN CONCLUSION
Explori aims to fill the gap left by current survey solutions that don’t account for data trends over time or across the industry. The platform can be used to create and disseminate surveys as well as review and interpret results, allowing planners to manage both aspects of collecting attendee feedback.
By incorporating internal and industry benchmarks, planners can understand performance indicators in a wider context to evaluate their event strengths and weaknesses and inform strategic direction. The tool can be useful to trade show exhibitors, corporate planners, and agencies that need to to improve event quality and demonstrate the overall impact and value of their event strategy.
Disclaimer: Reviews are paid for placements. While Event Manager Blog receives a fee to extensively look at the tool and review it in detail, the content of the review is independent and by no means influenced by the company. If you have any questions please use the contact us section.