How Virtual Event Platforms Can Help Measure Event Success

2020 helped to accelerate the rapid development of enhanced virtual event technology, and adoption rates have never been higher. Despite this progress, many still aren’t taking full advantage of what may be event technology’s greatest asset — hard data, or the information behind informed decision making. There are few better tools to measure virtual event success metrics.
At face-to-face gatherings, organizers can track attendees on-site with a final count at the end of registration, or by scanning in their badges. Visual cues are also used to measure their event’s success. In the virtual sphere, however, event organizers can no longer take a quick glance across the room to check engagement levels. On the other hand, if you choose a platform with good analytics, you don’t have to watch your attendees. The software does that for you.
Interested in finding out how you can use event management software to offer event sponsors measurable ROI?
Download The EventMobi Sponsorship Strategy Guide to get started!
What Analytics Features Can the Best Event Technology Offer?
The event technology that you choose will have a major impact on what tools are available to you. Besides monitoring attendee behavior, a well-designed interface can also help when it comes to reviewing the data. Virtual event platforms that allow you to break your metrics down into useful takeaways will be pivotal for future event success. How do you capture the notoriously short attention spans of online audiences? You figure out what’s working now, and then build on it.
Moreover, it’s not just a matter of providing your attendees with the optimal experience. It’s also about proving the event’s ROI to stakeholders and sponsors.
With this in mind, EventMobi recently launched an updated Analytics toolbox that works across both its virtual event platform and its mobile event app. This improved Analytics feature empowers event organizers to find the information that they need to stay competitive.
4 Key Virtual Event Success Metrics to Track at Future Events
The idea of analyzing event data may seem intimidating at first, but it helps to break the information down into four key categories:
- Attendance: Which activities drew the highest number of attendees, and who did they attract?
- Interest: What content generated the most traffic?
- Attention: What content kept viewers watching the longest?
- Action: Which attendees clicked on links or engaged with specific content?
EventMobi’s updated Analytics feature allows event planners to navigate through all of this data using an intuitive, user-friendly interface.
Ideally, the analytics section of a virtual event platform should provide you with a broad overview of key data while also allowing you to dig deeper. That’s why EventMobi’s virtual event platform includes a Dashboard that not only features easy-to-read graphs, but also provides the option to export the underlying data.
Start by thinking about the 4 key virtual event success metrics listed above. If you notice that a sponsored breakout session attracted an especially high number of attendees, you can download the full list of participants. This data could translate to potential leads for your sponsor.
On the EventMobi platform, there’s no limit to the number of sessions, company pages, or online activities that you can track.
Attendance & Interest: Measure Event Traffic Flow
If you want to know what draws attendees to your event, it’s essential to follow their movements within the event platform. This data can also be highly valuable to sponsors and other stakeholders.
Their marketing needs depend on the kind of demand generation that will ultimately lead to conversions. And event organizers need to show that they can deliver.
Foot traffic has long been a key measure of event ROI, especially at trade shows. On virtual event platforms, the comparable metric is page visits and content views.
It’s no longer enough to tell sponsors and other stakeholders about your overall event attendance numbers. At a virtual trade show, for example, you need to show sponsors and exhibitors how many potential leads they reached. You can also help them to improve their own marketing strategies. Did their banner ads, sizzle reels, or virtual booths draw the most traffic?
This kind of data is also essential for virtual conferences. Knowing which content generates the most interest can be the secret to securing repeat registrations at future events.
Event Technology Tools to Measure Attendee Interest
A good analytics tool should provide all this information upfront. EventMobi provides both an Attendance Report for the total login count, and a Page View Analyzer for tracking the traffic to specific sections of the platform. Event planners can even find out exactly who each of those unique visitors were.
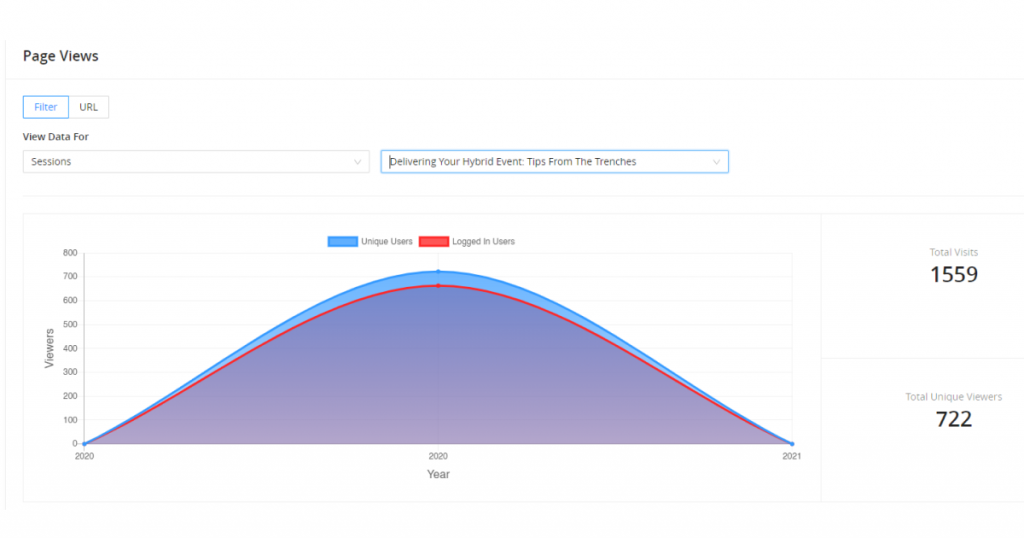
This feature also tracks the page views of specific items within a section. The URL option can also be used to check views of a specific page within the Event Space. Page view data is broken down by date and time, making it easy to see the highest traffic time periods over the course of an event.
Attention & Action: Measure Event Engagement
There are two important ways to measure engagement:
- Content viewing duration
- The number and type of actions taken
This data can help you to identify both the best content and the most engaged participants.
Taking a deeper dive can provide valuable insights. For example, it’s possible that the pre-recorded session with the most views might also have the highest drop-off rate. Conversely, another session with half the views might keep people watching till the end. Merge the attention-grabbing headline of the first with the engagement tactics of the second, and you will have a winning formula for future event content.
Similarly, this information can help sponsors to determine which content is most effective at communicating their brand messaging. Think about moving your audience down the marketing funnel from awareness to conversion. The viewers who watched sponsored sessions the longest are also likely to be the most viable leads.
This tracking ability can also be handy at virtual conferences, where CE credits can be awarded based on who watched educational videos to the end.
Event Technology Tools to Measure Engagement
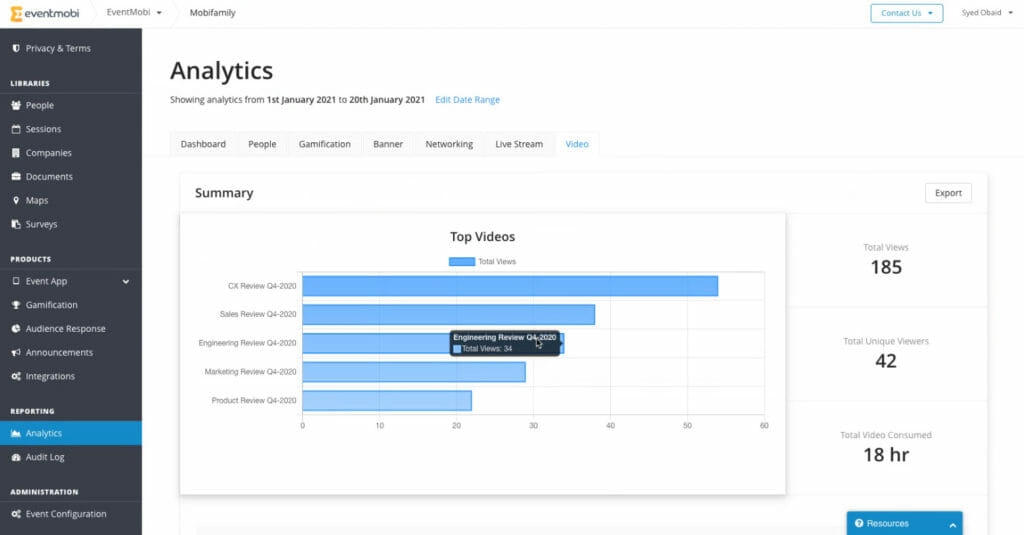
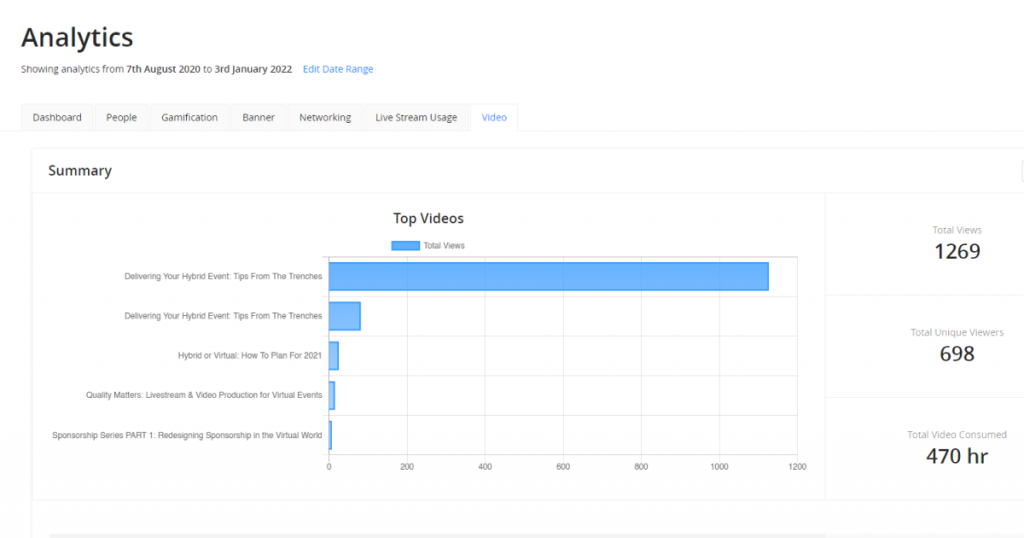
Whether your video content is live streamed or pre-recorded, you can use EventMobi’s Video Analytics Table to track both the number and the duration of views. EventMobi’s Video Analytics Graph also helps to visualize engagement metrics for those who like to absorb information at a glance.
The platform can also identify who visited the documents section in an an exhibitor profile, or who engaged in a specific group discussion. This information can provide the foundation for accurate market segmentation. Who is most likely to welcome an association newsletter? Who is on the verge of signing up for a new service? Thorough analytics can empower event planners to figure out the answers on their own.
Using Data to Ensure Future Event Success
Any event management team can benefit from a well-designed analytics feature. With the full suite of analytics offered through EventMobi, you can measure your virtual event’s success metrics by tracking:
- Attendance numbers, both on a macro and micro level
- Traffic to specific sections of the platform
- Content viewing duration
- Attendee actions
All of this information can be leveraged to troubleshoot shortcomings while expanding on successes. Further, it can provide sponsors with a list of their most promising leads, along with the engagement numbers to prove ROI. Digital formats demand digital solutions.