It’s time to tackle one of the hottest trends of the year, heat maps for events! So, you already know that here at Endless we love discussing event trends. And if this is your cup tea, then make sure you are up to speed with our complete guide for 2020, as well as all the marketing, design, and technology trends we’ve covered so far! But today, it’s time for heat maps to take the stage.
And who better to tell you all about it than Will Curran, our host, and the trend guy himself? If you’re looking for a way to take your event to the next level and implement some cool and new technology, this is your chance. Press play or keep reading to learn everything you need to know about heat maps for events. And trust us – it’s going to be worth it!
Heat Maps For Events: Manually Or Wearables?
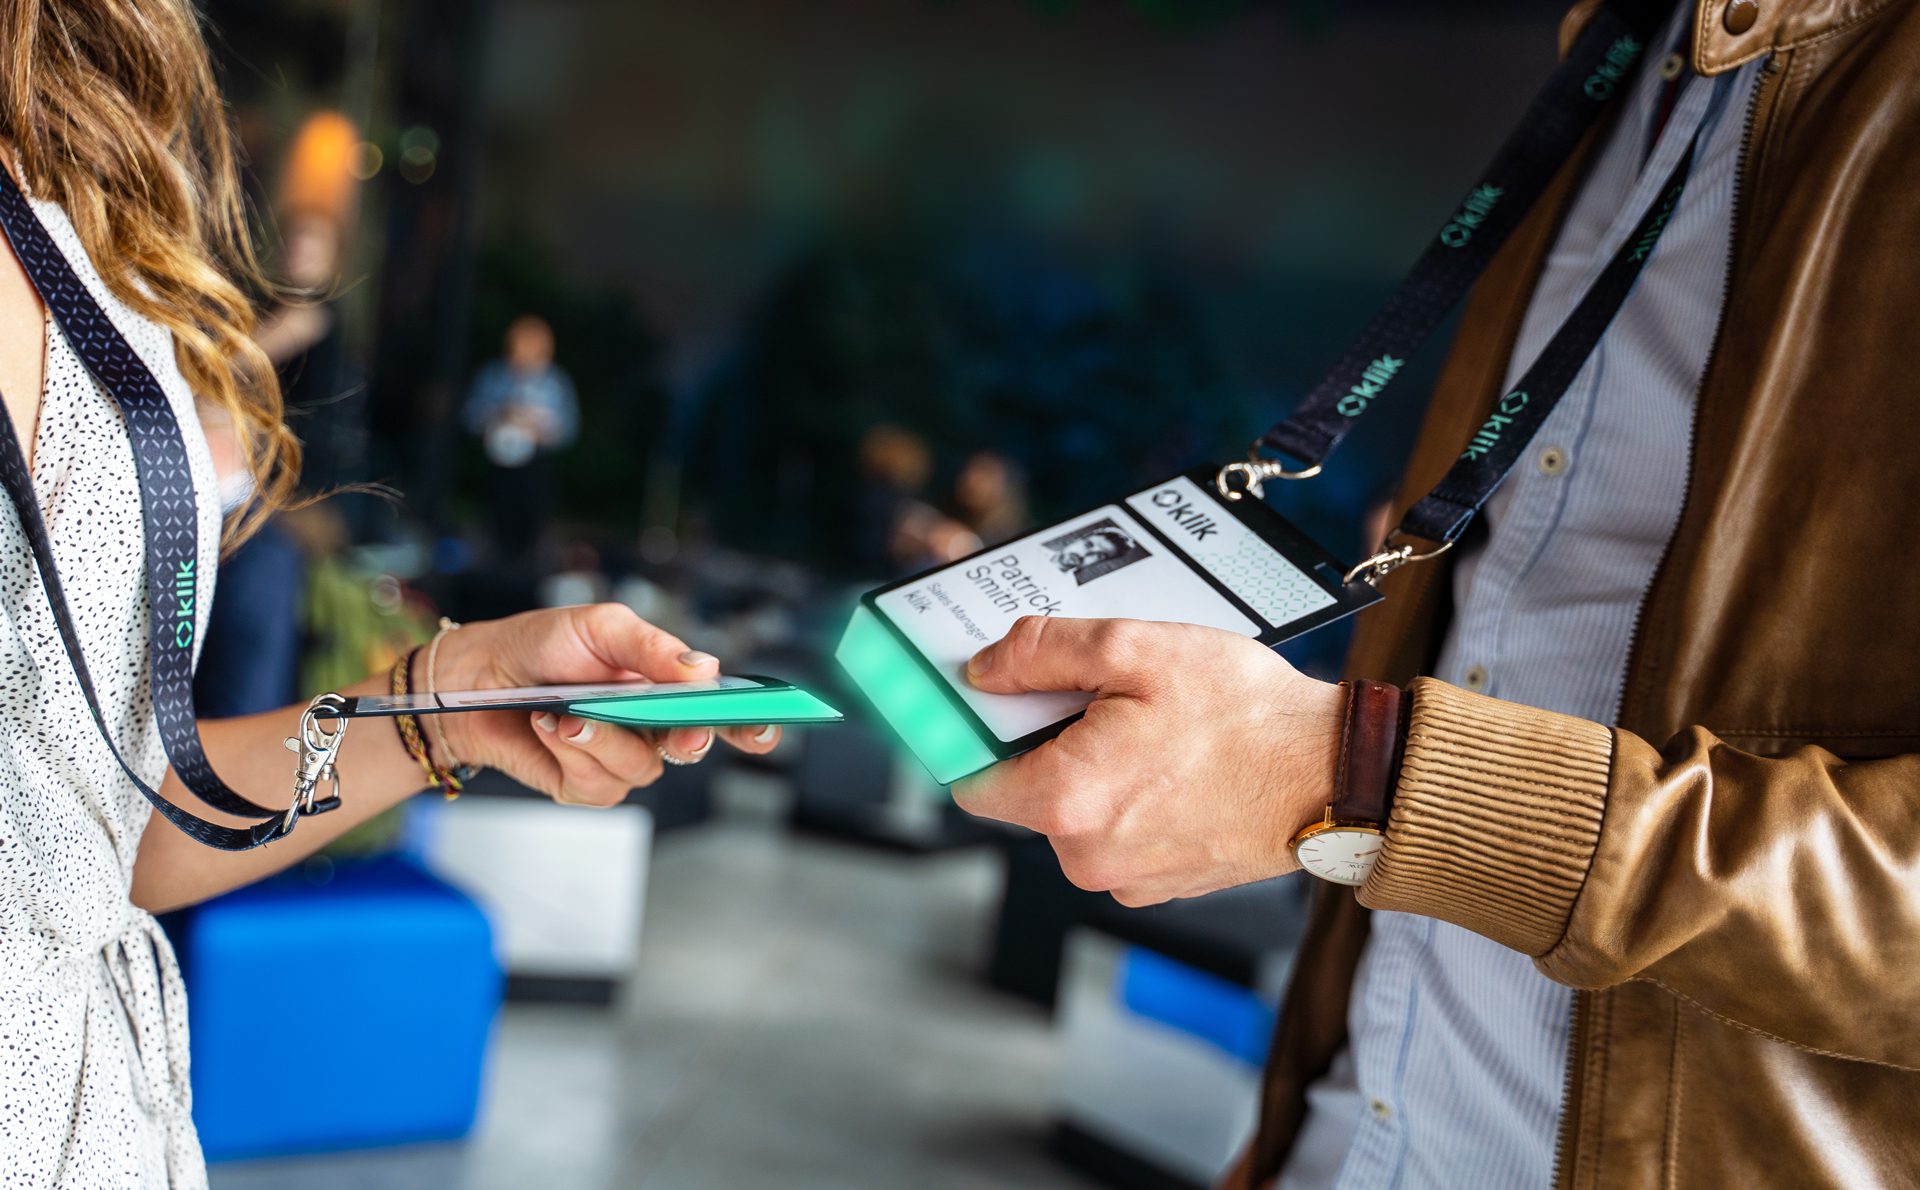
When it comes to heat maps for events, there are two routes you can choose. You can either go the old-school, manual way or implement a neat piece of technology we call wearables. As Will explains, “the piece of technology that you’re going to want to pick up are, for example, wristbands. Or it might be an actual physical badge with the tracker inside of it, most of which have trackers inside. Or if you have existing badges, you can also attach trackers to them”.
So, how does the tracking work? “The most common way of tracking and doing these heat maps is using Bluetooth Low Energy. However, you can also do this by using RFIDs”. Whichever one you decide on, just know that they are essential to make the technology work. “Once you have that, you have the ability to track people in two-dimensional space, essentially seeing where they’re going. In theory, if you wanted to, you could grab one attendee and watch them walk all the way around”. Cool!
Analyzing Movements
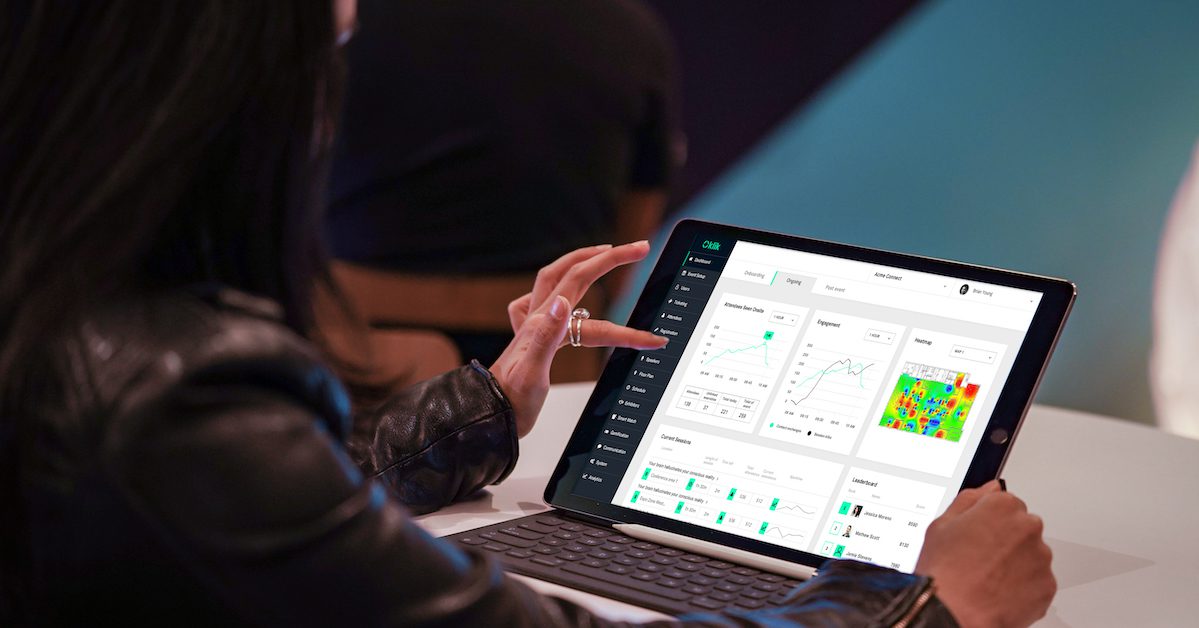
But what exactly do heat maps for events do? Well, they give us large amounts of precious data about our attendees. This way, we can analyze where people are congregating, how they’re moving, and what they’re gravitating towards. Will adds that “what’s cool about these, is they also have the ability to change over time. You can do a time-lapse from 9:00 AM to 5:00 PM, and see how it changes over time. So another awesome little characteristic right there!
How To Red Heat Maps For Events
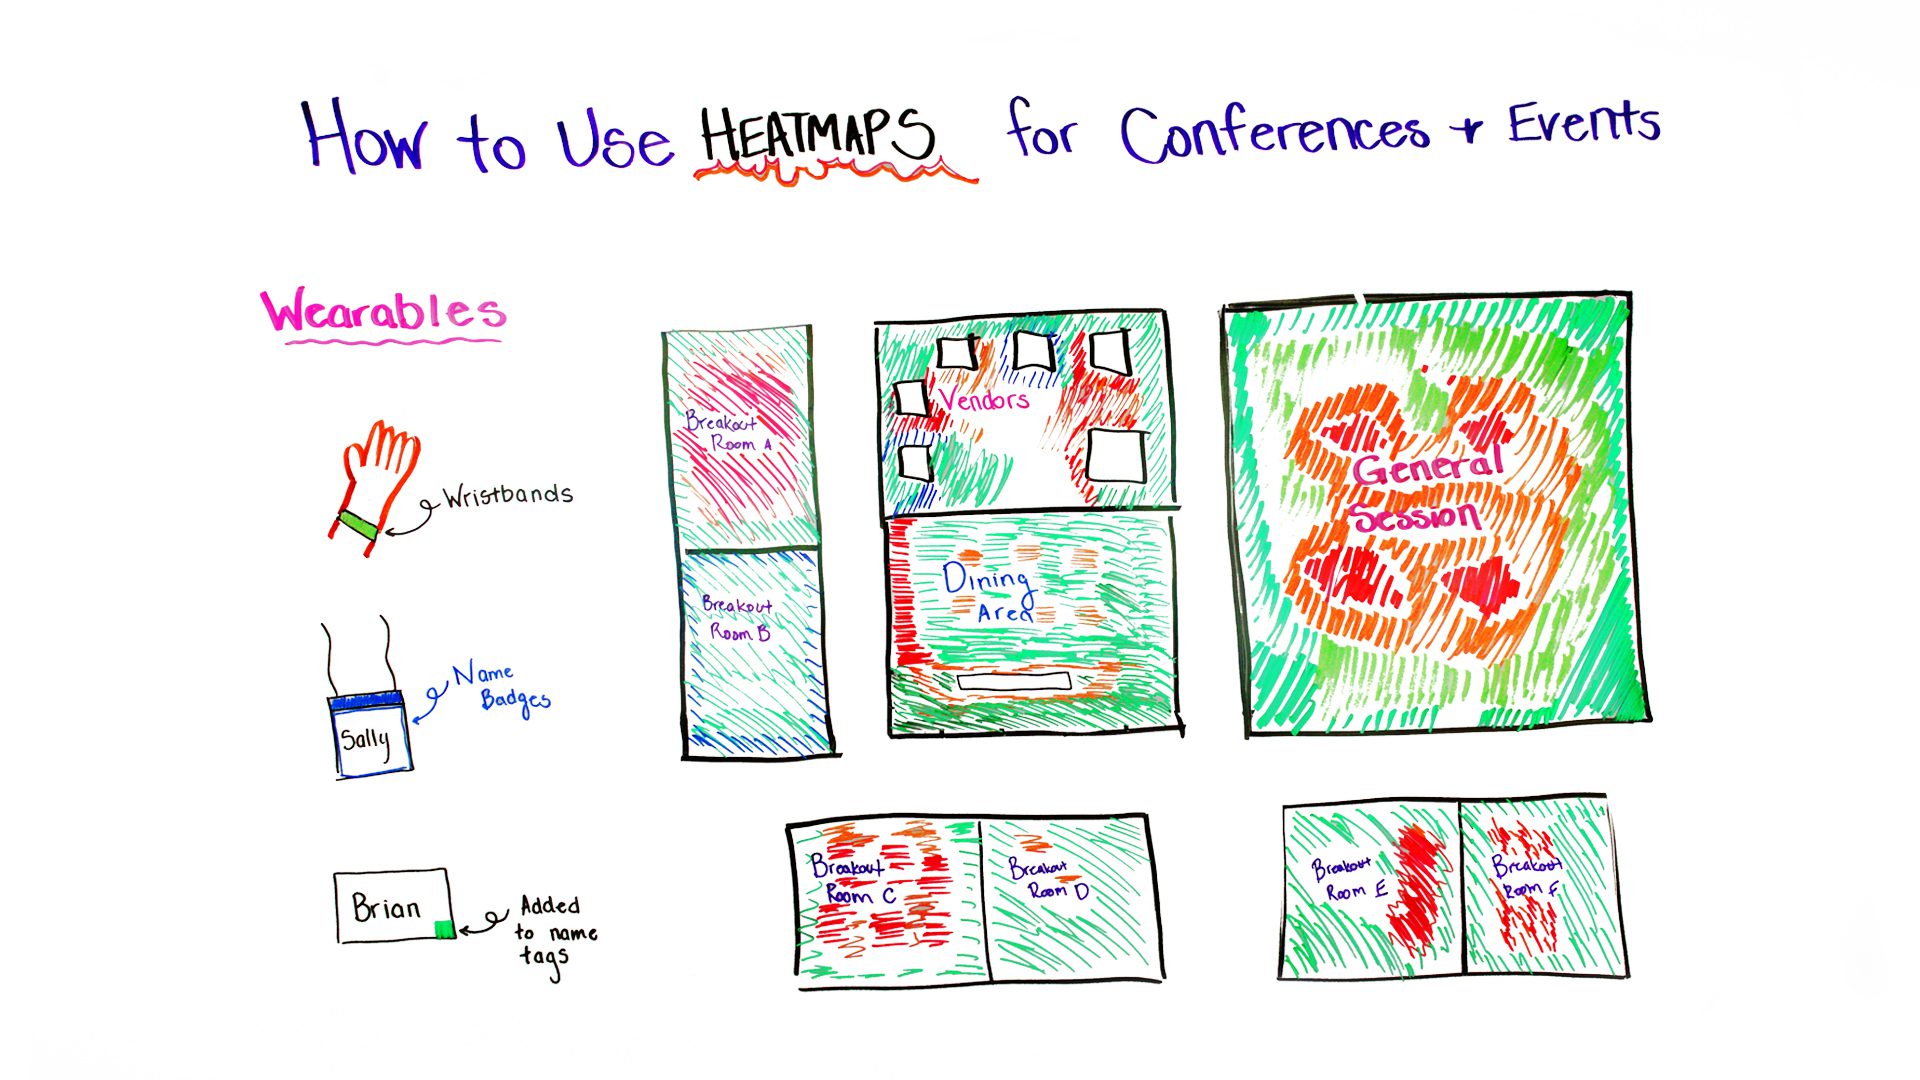
Reading a heat map isn’t rocket science. As Will explains, “the spectrum is from blue to red. Blue meaning least occupied and not a lot of people or no people. And red means a lot of people, very cramped, very active area”. Let’s take the example Will has pulled up. “An example of a blue area might be, for example, the edges of the room. Because let’s be honest, no one’s a wallflower, no one’s actually physically standing against the wall in a room. However, in an area that’s really popular, it might be something like, for example, this breakout room A. Then you can see the spectrum in between with yellows, greens, oranges, and so on”.
From One Side Of The Spectrum…
But there’s a lot more you can pull from a heat map! “In this case, there’s a blue border around this vendor hall. This is a vendor booth we know because we designed and drew this set up so we would know it’s a vendor booth. We can see there’s a lot of blue around here, which means there’s not a lot of people”. So, this tells us not a lot of people are visiting that particular vendor. And we might wonder if there is there something weird about it? Are they just not popular? And a myriad of other questions you can ask and act upon because heat maps for events give you this data in real-time.
…To The Other!
“The other extreme, which is red, means very congested, lots of people, very active”, explains Will. “Let’s start over here in the general session. You can see these red pockets on here. Obviously, there’s two specks of red on here. It turns out that’s where our stage is. So obviously, there’s always going to be someone on stage inside the general session. But you can see these pockets here. Well, it turns out that our event is done with 100% round tables. We’re doing round tables around here so you can see these four pockets are red on here. What that might mean is those are the four popular tables”. See how the data keeps pouring?
This would allow you, for example, to question why these tables are so popular. “It turns out maybe the coffee is right next door to it or something like that. Maybe it’s something like they have the best view in the house. There are a lot of different options and questions you can ask yourself. Let’s say, for example, if your event had a lot of people in the back of the room, but not a lot of people in the front. Maybe people were trying to stick near the exit”. The possibilities for improving your event by asking these questions and gathering the data from heat maps for events are endless!
What Else Can Heat Maps For Events Teach You?
Will continues to analyze his heat map. “Let’s go down to these breakout rooms. So, you can see these common areas that are red in here. This might again denote that these breakout rooms are really, really popular. But you can look at breakout room D and breakout room B. They’re not as red. Let’s look at a schedule. What sessions are going on? Who’s speaking? Is anything even happening in there or is it completely empty? Or is it something where maybe they just got done early and now everyone’s moving into breakout room E and F?”. So this allows you to see in real-time what content is popular in your conference or at your event. Data that will come very much in handy when your post-analyzing your event and planning the next one!
Diving Into Logistics
“In the dining room, you see a big streak of red in and you can see some orange”, Will explains. “It turns out this orange is where the tables are. And obviously, they’re going to be very busy where people are sitting down to eat. But you see this big long red, and then, it turns into orange. What this means is there’s a huge long line of people waiting in the dining room area”. Now, this is the kind of data that, by being available in real-time, allows you to immediately take action. Maybe there’s not enough food or it’s not coming out at a fast enough speed. You can immediately improve on certain aspects, and take others into consideration so you can improve them either the next day or the next time you’re holding your event.
“Heat maps for event allow you to gather a lot of information really, really quickly, as far as what’s going on inside your event”, adds Will. “What’s also cool, in these hallways, in this corner, for example. Maybe it’s really red”. What’s great about this is it shows that there’s a lot of people interacting or stopping here. But it also might give you an idea of how to improve a room or space that is crowded and clearly preferred by your attendee. “Maybe we can put some high boy tables over here so people can hang out, rather than just standing there, for instance”.
Heat Maps For Events: Networking!
“Another cool thing is that with these RFID technologies, you can exchange contact information. So you might be able to see where are the contact points where people are exchanging contact information the most on here, as well”. Yet another awesome way heat maps for events allow you to gather data about your attendees and your conference!
Conclusions
And that’s all for this week’s episode of Whiteboard Wednesday! So, are you excited to give heat maps for events a try? We really do advise you to go ahead and see what you think. The possibilities for what this can tell you about your event are surprisingly big. So make sure you check out our resources section below and join us again next week for another awesome episode!
Resources